
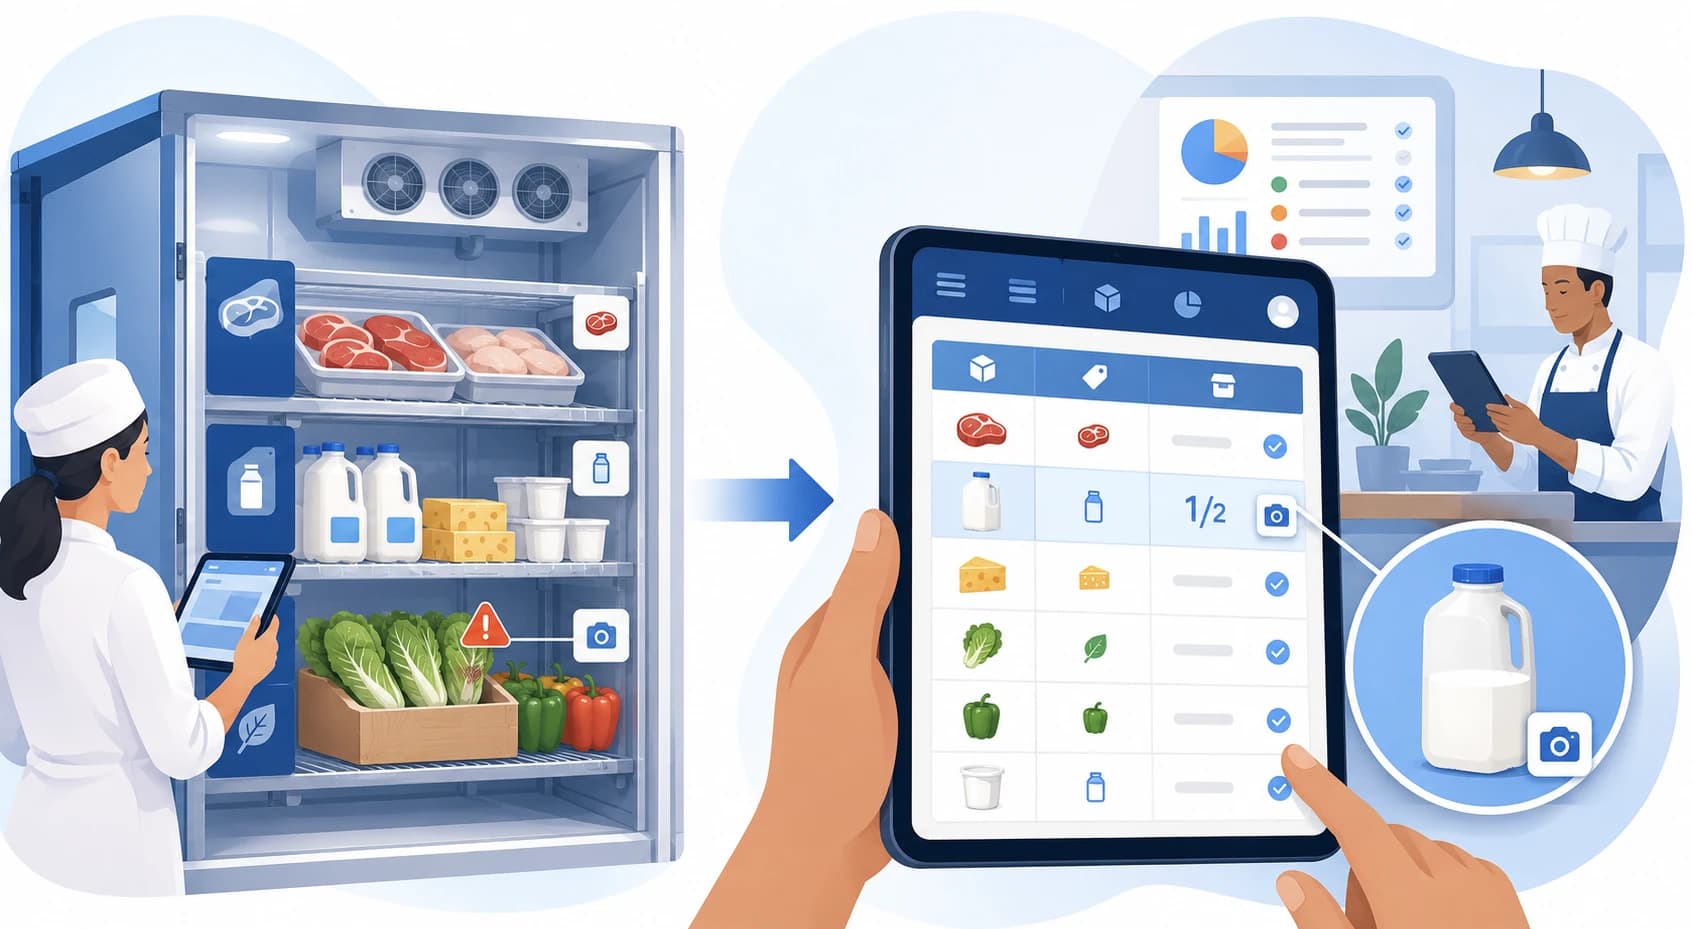
A Restaurant Inventory Count Example
Most operators have never seen a fully-documented, well-structured inventory count — they've only ever seen their own, which they built by guessing at what seemed reasonable. That's usually fine until two people count the same walk-in a month apart and produce numbers that can't be compared to each other. Seeing one clear example of what a good count actually contains is often more useful than another explanation of why counting matters.
This walks through a real example count for one section of a kitchen — a walk-in cooler — item by item, so you can see the level of detail that makes a count usable rather than just a list of numbers.
TL;DR
- A good count records more than a quantity: it captures a fixed unit and current cost — and anything unusual stays visible through a photo or the historical price record, not a separate notes field.
- Vague item names and inconsistent units are the two most common ways a count sheet becomes useless a month later.
- The example below covers a walk-in cooler section with proteins, dairy, and produce — the same structure applies to dry storage or a bar.
- A count is only as useful as its ability to be compared against last week's — which means the format has to stay identical every time.
The Setup: What's Being Counted and When
This example covers a walk-in cooler count taken Monday morning before the week's main delivery, for a single mid-size independent restaurant. The count happens at the same point every week — after Sunday close, before Monday's delivery — so every count is comparable to the last one without needing to account for a delivery that landed mid-count.
The Example Count
| Item | Unit | Quantity Counted | Unit Cost | Extended Value |
|---|---|---|---|---|
| Chicken breast, raw | lb | 38.5 | $3.40 | $130.90 |
| Ground beef 80/20 | lb | 22.0 | $4.10 | $90.20 |
| Salmon fillet | lb | 11.25 | $8.75 | $98.44 |
| Whole milk | gal | 6.0 | $3.60 | $21.60 |
| Heavy cream | qt | 3.0 | $4.20 | $12.60 |
| Shredded cheddar | lb | 9.5 | $4.00 | $38.00 |
| Eggs | dozen | 14.0 | $6.20 | $86.80 |
| Romaine lettuce | case | 1.5 | $28.00 | $42.00 |
| Tomatoes | lb | 18.0 | $2.10 | $37.80 |
| Butter, unsalted | lb | 12.0 | $3.90 | $46.80 |
Section total: $605.14 (added up here for the walkthrough)
A few of these numbers carry context worth knowing: the chicken breast is 38.5 lb because two full 40 lb cases had 1.5 lb pulled for Sunday's prep before the count; the salmon fillet is a partial case, with the rest used Saturday; four of the six milk containers are partial jugs, each estimated at half full; the cheddar is one full 5 lb bag plus a partial bag at roughly 4.5 lb; one of the two romaine cases is visibly wilting at the edges; the tomatoes are whole only, since prepped and diced tomatoes get counted separately; and the eggs are priced at $6.20 a dozen, reflecting a recent market increase from the supplier.
What Makes This a Usable Count (Not Just a List of Numbers)
Every item has one fixed unit, and it doesn't change. Chicken is always counted in pounds, eggs are always counted by the dozen, cheese is always counted by weight rather than by bag. If next week's count switches shredded cheddar to "bags" instead of pounds, the two numbers stop being comparable — the unit column is what makes trend comparison possible at all.
Partial containers are estimated consistently, not skipped. The four partial milk jugs are recorded as 0.5 gallon each rather than left out of the count entirely. Skipping partials because they're "close enough to empty" is one of the fastest ways a count quietly understates what's actually on hand.
Item names are specific enough not to overlap. "Tomatoes" explicitly excludes prepped or diced tomatoes, which get their own line under prep inventory. Without that distinction, two people counting on different weeks might include or exclude prepped product inconsistently, and the resulting numbers won't reconcile.
Anything unusual should be visible, not just implied by a number. On a paper sheet, that usually means a handwritten note next to the wilting romaine or the higher egg price. Dinezy handles it differently: instead of a notes field, you can attach a photo to an inventory item, so a case that's starting to turn is visible in the record itself — and a price change like the eggs is already visible in the item's purchase history once the delivery is recorded at its new price, without anyone needing to flag it manually.
What This Count Enables
On its own, a single count is a snapshot. Its value comes from what it connects to:
A reorder decision. The chicken breast line shows 38.5 lb on hand. If that's below the par level set for chicken, Dinezy's low-stock list flags it and suggests a reorder quantity — the gap between this count and the max level set for that item — so Monday's order is based on this week's actual count instead of a guess.
A recipe cost check. The egg price on this count ($6.20/dozen) is higher than it may have been on a count from a few months earlier. Any recipe using eggs should reflect the current price, not an older one — otherwise the recipe cost understates what the dish actually costs to produce today.
A trend line. Compared against last week's count, this week's numbers show whether usage on any item is drifting from what's expected — the kind of pattern that's invisible from a single count but obvious once a few weeks are lined up side by side.
How Dinezy supports this. Dinezy structures every count around this same discipline: a fixed unit per item (with an optional photo so staff can visually confirm what they're counting), a submit-and-approve workflow so a manager reviews the count before it becomes official, and a permanent history so this week's count sits next to every prior one automatically. When an ingredient's price changes — like the eggs in this example — recipe costs using that ingredient recalculate the moment the new price is entered at receiving, so the connection between what's on the shelf and what a dish costs stays current without rebuilding a spreadsheet each time. And when an item like chicken breast drops below its par level, Dinezy's low-stock list flags it and suggests a reorder quantity based on the min/max levels you've set, instead of leaving restocking to a guess.
Frequently Asked Questions
How do I flag something unusual on a count, like a wilting case of lettuce? On a paper count sheet, that's usually a handwritten note. In Dinezy, the equivalent is a photo attached to the inventory item — a case that's starting to turn is visible in the record itself, without a separate notes field. A price change, like eggs going up, doesn't need to be flagged manually at all — it's already visible in the item's purchase history once the delivery is recorded at its new price.
Should partial containers be weighed exactly or estimated? For high-cost items — proteins, specialty ingredients — weigh them when practical. For lower-cost dry goods, a consistent visual estimate (quarter, half, three-quarters full) is usually accurate enough, as long as the same estimation method is used every time so the numbers stay comparable.
What's the difference between counting for reordering and counting for food cost? Counting for reordering and counting for food cost use the same physical count, but reordering only needs current quantity against par level. Food cost calculation needs the extended dollar value (quantity × current unit cost) for every item, which is why unit cost has to be current — an outdated unit cost understates the value of what's actually on the shelf.
How long should a count like this take? For a single walk-in section with roughly 10–15 items, 5 minutes is typical once the format is standardized. Most of the time lost in counting comes from inconsistent formats and unclear item boundaries — the things this example is built to avoid — not from the physical act of counting itself.
Key Takeaways
- A usable count records a fixed unit, quantity, and current unit cost for every item — and keeps anything unusual visible through a photo or the historical price record, not a separate notes field
- Fixed units and specific item names are what make one count comparable to the next
- Partial containers need a consistent estimation method, not to be skipped
- A single count is a snapshot; its real value comes from being compared against prior counts and connected to recipe costs and reorder decisions
Dinezy structures every count with a fixed unit per item, a submit-and-approve review step, and a permanent count history — so a count like this one connects automatically to current recipe costs and sits alongside every prior count for comparison. Try Dinezy free at dinezytech.com.